


.png%3Falt%3Dmedia%26token%3Db8f3689d-f9dc-48af-8ef7-fbec253788a5&w=3840&q=75)
Power BI Interview Questions: From Basics to Advanced
Key Highlights
Discover the most common Power BI interview questions, from beginner to expert level. If you are applying for BI roles, especially those involving Tableau, you'll also encounter frequently asked Tableau interview questions for beginners—such as 'What is Tableau?', 'How do you connect Tableau to a data source?', 'What is a dashboard in Tableau?', and 'Explain the difference between a worksheet, dashboard, and story in Tableau.' Understand the key differences between Power BI, Tableau, and Excel in a job interview context. Get ready for scenario-based questions on performance, errors, and dashboard design.
Understand the key differences between Power BI, Tableau, and Excel in a job interview context.
Learn about crucial data analysis concepts like data modeling, DAX, and relationships.
Get ready for scenario-based questions on performance, errors, and dashboard design.
Explore advanced business intelligence topics like security and data refresh strategies.
Find tips on how to effectively present your data analytics projects to recruiters.
Introduction
 Welcome to the world of data analytics! If you want to work in business intelligence, knowing Power BI is very important. Power BI is a strong tool from Microsoft. It helps you turn raw data into clear stories that people can understand. A lot of companies use it because it helps them make good choices. That is why interviewers like to check your Power BI skills. In this guide, you will find a full list of Power BI interview questions. You will see basic questions for people who are new, and harder ones for those with experience. These bi interview questions will help you get ready for interviews about analytics and land your dream job.
Power BI Interview Questions: From Basics to Advanced (2026 List)
 Getting ready for a Power BI interview means you need to know many things. The people hiring will check if you know the technical side, if you can solve problems, and how well you can explain what the data means. They need to be sure you can do things such as getting data from different sources and making a dashboard for the top people in a company.
To help you with this, we have put together some common Power BI interview questions for business intelligence jobs. You will find questions about basic ideas, how to handle data, DAX, and making dashboards. We will also talk about challenges you may see on the job. Let’s begin. If you are preparing for a Tableau interview, be sure to highlight technical skills that include data visualization techniques, proficiency in connecting and preparing data sources, creating interactive dashboards, using calculated fields, and understanding SQL for data querying. Demonstrating your ability to leverage Tableau’s advanced features, such as Level of Detail (LOD) expressions and performance optimization, can also be valuable.
1. What is Power BI and why is it important in analytics roles?
Power BI is a tool from Microsoft for business intelligence and data visualization. You can use it to connect to many data sources, clean up messy information, and create reports and dashboards that you can interact with. The main goal is to help you and your team use data to make better choices.
In Tableau interviews, scenario-based questions typically focus on real-world situations where you must analyze complex datasets, design insightful dashboards, or troubleshoot data connection issues. You might be asked how you would visualize sales trends for a retail company, handle missing data during analysis, or optimize dashboard performance for executive reports. These questions are designed to test both your technical skills and your ability to solve business problems using data visualization tools.
In any data analytics job, you need to turn numbers into ideas that people can act on. Power BI is a data visualization tool that helps you do this easily. You get to look at important business metrics as they happen, spot trends, and share what you find with others. Employers really want people with this skill. While Power BI is crucial in analytics, if you're preparing for Tableau interviews as a beginner, you'll commonly be asked questions such as: What is Tableau and how is it different from other BI tools? How do you connect Tableau to a data source? What are worksheets, dashboards, and stories in Tableau? Can you explain the concept of filters and parameters? How do you use calculated fields in Tableau? Understanding these basics will help you confidently tackle tableau interview questions.
If you are getting ready for a job interview for Power BI or Tableau, make sure to talk about how you can handle every step of the data workflow. This includes connecting to data sources, cleaning data, setting up data models, making calculations, and building simple but powerful data visualization tools. These analytics skills show you are a valuable part of any business intelligence or analytics team.
2. What are the main components of Power BI (Desktop, Service, Gateway)?
Power BI is a set of tools that work as one. The main parts of this suite are Power BI Desktop, Power BI Service, and Power BI Gateway. It is important to understand how they all work together.
If you are transitioning from Power BI and preparing for a Tableau interview, start by mapping the similarities and differences between the main components of Power BI and their counterparts in Tableau (such as Tableau Desktop, Tableau Server, and Tableau Online). Focus on understanding Tableau's terminology, interface, and workflow, and be ready to explain how your experience with Power BI's Desktop, Service, and Gateway can translate to using Tableau's platforms.
Power BI Desktop is a free tool you can put on your computer. You do most of your work here. This is where you connect to data sources. You also use Power BI Desktop to build your data model and make your reports by adding different visuals. It is the main tool for making and putting together your analysis.
If you're answering an interview question about your Tableau project experience, the best approach is to structure your explanation like you would for Power BI: mention the specific data sources you connected to in Tableau, describe how you designed and built your data models, and highlight the insights or visuals you created. Be sure to reference any challenges you overcame and the impact your project had on decision-making or business goals.
When your report is done in Power BI Desktop, you move it to the Power BI Service. Power BI Service is run on the cloud server. Here, you can show your reports and dashboards to other people. It lets you set up things like automatic data refreshes. People in your group can work with you on the same stuff. The Power BI Gateway links Power BI Service and your data sources that you keep on your company’s server. This makes sure the data in the cloud is always fresh and up-to-date. You do not have to do anything by hand for this. If you are preparing for a Tableau interview and need to answer a question about dashboard design best practices, focus on principles such as maintaining clarity and simplicity, organizing layout for easy navigation, using consistent formatting, and ensuring interactive elements enhance user experience. Mention the importance of choosing the right visualizations for the data, keeping performance optimized, and always considering the target audience's needs.
3. How does Power BI differ from Excel for data analysis?
Both Power BI and Excel are Microsoft tools you can use for data analysis, but they are not made for the same things. Excel works best for tabular reports, financial models, and detailed math in a spreadsheet. With Excel, it is simple to handle duplicate tables or do deep data analysis inside the sheet.
A common Tableau interview question related to data blending is: "What is data blending and how does it differ from data joining in Tableau?" You can answer by explaining that data blending is used when you need to combine data from different data sources in Tableau, creating a left join like relationship after aggregation. Data joining, on the other hand, works with tables from the same data source and happens on the row-level before aggregation.
Power BI is better when you need to do big data visualization and business intelligence work. It lets you build interactive, personal reports where the charts and graphs work well together because they filter each other when you click. Excel does have some charts, but they are not connected to a strong data model, so they are not as interactive.
For experienced candidates preparing for interviews, advanced Tableau topics that may come up include data blending, complex calculated fields, level of detail (LOD) expressions, optimizing dashboard performance, integrating Tableau with other data sources, creating dynamic dashboards, and understanding Tableau Server or Tableau Online deployment and administration.
The best thing about Power BI is how it manages huge sets of data and connects to different kinds of data sources with no stress. It is used to create dashboards, watch important KPIs, and get real-time insights, so it is a better choice for today’s data analytics needs than just Excel. In an interview, you may be asked about the difference between a Tableau calculated field and a parameter. A calculated field in Tableau is used to create new data based on your existing data using formulas, whereas a parameter is a single value that can be used to dynamically change calculations, filter views, or swap between metrics. Calculated fields generate new columns or measures, while parameters act as user-driven inputs to make dashboards more interactive.
Both tools are great, but Power BI offers more features for data visualization and working with business intelligence in big or fast-growing companies.
4. Power BI vs Tableau: What should you say in an interview?
When the interviewer asks you to talk about Power BI and Tableau, they want to make sure you know the main points in business intelligence. The best way to answer is to go over the key differences between the two tools. Do not pick one as the best. Start by saying both Power BI and Tableau are top data visualization tools.
Power BI works with DAX, or Data Analysis Expressions. This is a lot like Excel formulas, so it is easy for many people in data analysis to pick up. Tableau works with MDX, which stands for Multidimensional Expressions. Tableau also has many visualization choices and lets you customize things in great detail. Power BI is good if you want an easy-to-use tool. It also blends well with the Microsoft family of products. Tableau gets praise for how well it works with really big sets of data and how strong it is for cloud support on Tableau Server.
If you want to go from Power BI to Tableau, speak about your skills that carry over. Tell the interviewer you already know about data modeling, ETL, and building dashboards for analytics in BI. Say you are learning about how to use Tableau’s special parts, like its way of handling calculations and its interface. This helps you show you can adjust, learn new things, and truly get the main ideas of business intelligence.
5. What types of data sources can Power BI connect to?
Power BI is very flexible. This is one of the best things about it. It can connect to a lot of different data sources. You can get your data from almost anywhere your business stores it. This helps you see all your information in one place for analytics. You do not have to stick to just one file type or server.
You can connect Power BI to files, big databases, and online services. This is good for business intelligence. Most companies keep data on many systems, so you need this kind of tool. It does not matter if your data is in an SQL server or inside a PDF file. Power BI can help you import and use that data.
Some of the data sources you can connect to include:
File Sources: Excel, CSV, XML, JSON, and PDF files.
Database Sources: SQL Server, Oracle, MySQL, and PostgreSQL.
Online Services: Google Analytics, Salesforce, Dynamics 365, and Power BI datasets.
Cloud & Big Data: Azure Blob Storage, Google BigQuery, and Amazon Athena.
Other Sources: Data from web pages (by URL), APIs, and scripts in R or Python.
6. What is data modeling in Power BI?
Data modeling in Power BI helps you turn your raw data into something you can use for reports and analysis. Think of it like you are making a plan for your data before you start to build charts. You need to set up your tables and link them the right way so your numbers are right and your report moves fast.
You do this after you connect to your data sources. You set up tables, build links between these tables, and add things like measures or columns to help bring more details to the data. If your data model is built well, your Power BI report will be better and more trustworthy.
If you skip proper data modeling, there is a good chance you will get wrong answers or your reports will be slow, especially with a large amount of raw data. Modeling your data is the first thing to do to turn messy numbers into something clean that you can look at and use right away in Power BI.
7. Explain different types of relationships in Power BI (one-to-many, many-to-many).
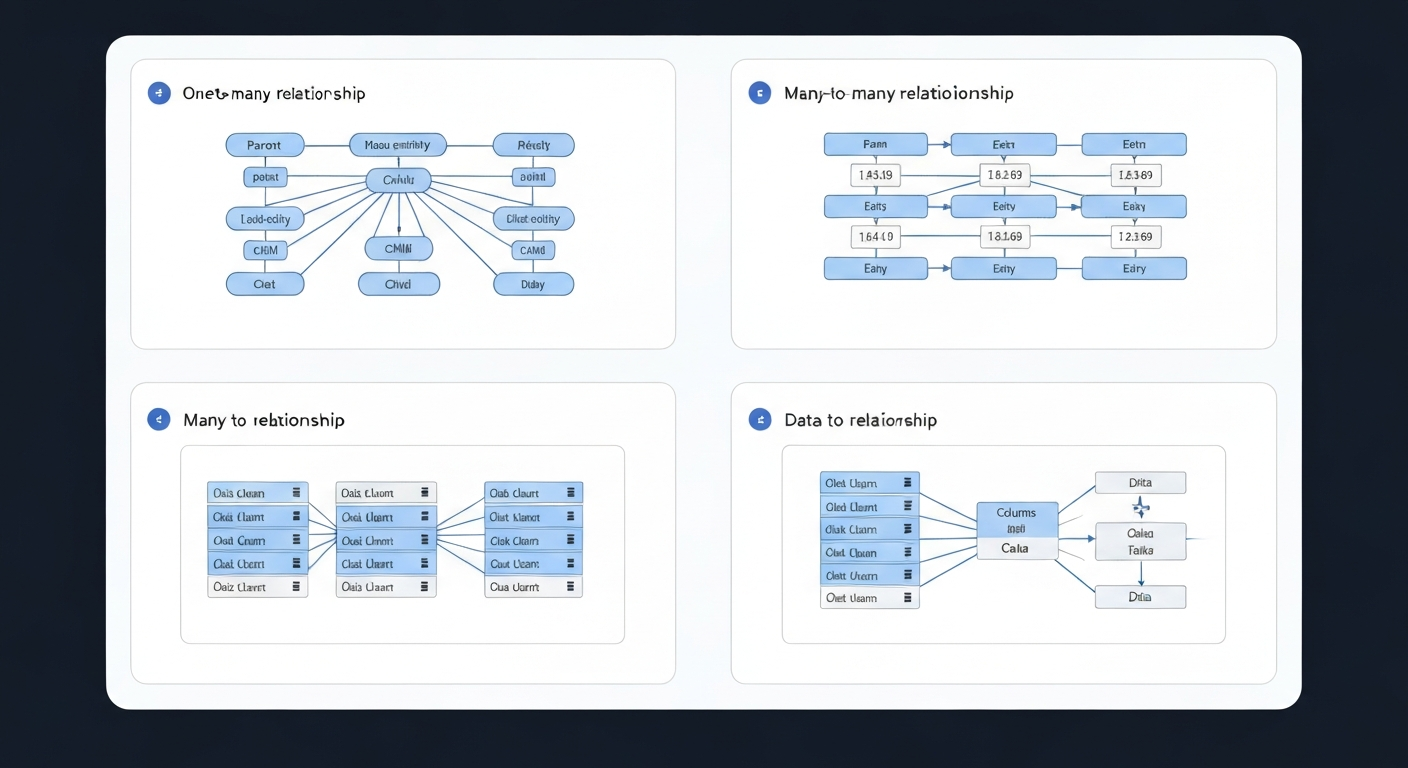
In Power BI, relationships show how your tables are linked in your data model. This is very important. These links help with filtering your data. They also make sure your numbers and reports are right across the tables. The two main types are one-to-many and many-to-many.
A one-to-many relationship is very common and simple. It means that one row in a table is linked to many rows in another. For example, one customer from the 'Customers' table can have many orders in the 'Orders' table. But each order belongs to just one customer.
A many-to-many relationship is a bit harder to set up. Here, many rows in one table can match to many rows in another. For example, a student can join many courses, and a course can have many students. Power BI uses a bridge table for this. It sits between your two main tables. This helps link the records in both tables.
Knowing about one-to-many and many-to-many links will help you use Power BI much better. When you know how these work, you get the right results. It also helps you build good models in your BI project.
8. What is the difference between a star schema and a snowflake schema in Power BI?
In data science and business intelligence, how you set up your data models in Power BI affects how well things work and how easy it is to use. Two main ways to make these models are the star schema and the snowflake schema.
A star schema is the easiest and most used way to build a data model. You set up a main table, called the "fact table," where you put your numbers (like sales totals). This fact table links to other tables, called "dimension tables," that tell more about each number, such as which product, the customer, or the date. The whole structure forms a star shape. The fact table sits in the middle, and the rest spread out from it. Many people choose the star schema in Power BI because it keeps things easy and makes running queries fast.
A snowflake schema works a lot like a star schema but goes a step further. Here, your dimension tables are split into even more tables. For instance, the Product table might split into Product Category and Product Subcategory. This setup helps you use less space because it doesn’t repeat the same data but brings a few more tables and connections to keep track of. This extra detail can sometimes slow down queries compared to the faster star schema.
Power BI is a useful tool in business intelligence and data science, and knowing about these data modeling techniques helps create good solutions for your work.
9. What is cardinality and filter direction in Power BI data models?
Cardinality and filter direction are two main ideas in Power BI data models. They help decide how your tables talk to each other. It's important to get them right for your reports to be correct.
Cardinality is about the kind of connection two tables have. It tells you if the data values in the columns linked together are unique or not. The common types are one-to-many, one-to-one, and many-to-many. For example, one customer can have many orders, one worker can have just one worker ID, or many students can take many courses. Picking the right cardinality helps Power BI add up your data the right way.
Filter direction in Power BI shows how data values move between connected tables. There can be a single direction or a bi-direction (also called cross-filter). In a single direction filter, if you filter a table for 'Customers', it filters the 'Sales' table too. But if you filter the 'Sales' table, it does not change what pops up in the 'Customers' table. A bi-direction filter means you can filter both ways, but be careful. It can make things unclear and slow down your reports in Power BI.
10. What are best practices for data modeling in Power BI interviews?
When you are asked about data modeling best practices in an interview, they want to see if you can build BI reports that are quick, not too big, and right. Your answer should show that you know how to set up a data model that will work well for the team and will also be easy to keep going later.
Start by saying that the goal is to build a model that is both simple and strong. Try to keep it easy to follow by cutting out things you do not need, but not lose the main things the report needs to do. If your model is clean, it will run well and be easier for people to use with fewer mistakes. This helps with data accuracy and consistency.
Some best practices you should talk about are:
Use a Star Schema: Pick a star schema, which is a main fact table in the middle with the other tables around it. This is simpler than a snowflake schema. It makes links easy and helps your BI tool run faster.
Reduce Data Size: Before you bring in any data, get rid of columns and rows that you will not use. A model that has less data is always better and quicker.
Minimize Cardinality Complexity: Try to use one-to-many links instead of many-to-many. Do not use filters that go both ways unless you really have to, because they can make your model harder to use.
With these steps, you can help make good BI reports with better data accuracy and great consistency.
11. What is DAX and why is it important for Power BI?
DAX stands for Data Analysis Expressions. It is a formula language that you use in Power BI for custom calculations. You can think of it like Excel formulas, but it is made for data analysis in a data model.
DAX is important because it lets you do more with your data. You can use DAX to make new information that is not already in your data. For example, it helps you figure out year-over-year growth, moving averages, or profit margins. These can be done as a calculated field or a measure. This is what makes Power BI a better tool for business intelligence and data analysis.
If you do not use DAX, your reports will only use basic math, like sum or average of the data you have. DAX helps you get much more from your data. It unlocks advanced calculations, gives you better business insights, and helps keep your data accuracy in your reports.
12. What’s the difference between calculated columns and measures in Power BI?
Understanding the difference between calculated columns and measures is important in DAX. Many interviewers ask about this. Both are made using DAX formulas, but they do not work the same way. Each has its own use.
A calculated column is a new column you add to a table that is already there. The DAX formula you use for this is run for each row in that table when you refresh your data. The results for the calculated column are saved in your model. This will use up memory and causes your file to be bigger. You should use a calculated column when you want to set a value for every row. An example is picking if sales are "High" or "Low" in each row, based on how much was sold.
A measure works differently. It does not keep values in the model. Instead, it does the calculation only when needed, like when someone looks at your report and uses filters or slicers. Measures are often used for aggregation. For example, you might use a measure to get the total sales, average price, or the percent of all sales. Since measures are seen only when they are used, they do not make your model any bigger and are good for working with summaries of data.
13. Name and explain common DAX functions used in interviews (SUM, CALCULATE, FILTER).
Interviewers like to ask you about DAX functions to see if you have real skills. The functions SUM, CALCULATE, and FILTER are really important. You should know these very well. The three of them are used a lot in data analysis.
SUM is an easy function to use. It adds up the numbers in one column. This one is key for building basic metrics, and you will use it often in data analysis work.
CALCULATE is maybe the strongest function in DAX. You can use CALCULATE to change which data is looked at while measuring something. This helps you build new metrics by looking at data in different ways. You can get results for special cases, not just what your report already shows.
FILTER is a DAX function that helps you get a smaller group of rows based on rules you set. This one gives you more control than what you can do just by filtering. Many times, people use FILTER together with CALCULATE to write data analysis measures.
SUM: Adds up all the numbers in a column. Example:
SUM(Sales[SalesAmount])CALCULATE: Looks at an amount using different filters. Example:
CALCULATE(SUM(Sales[SalesAmount]), Sales[Country] = "USA")FILTER: Makes a new table by using set rules. Example: `CALCULATE(SUM(Sales[SalesAmount]), FILTER(Products, Products[Color] =
14. What is the difference between row context and filter context in DAX?
Row context and filter context are two important ideas in DAX that help decide how formulas get evaluated. It is good to know how they are not the same because it helps you write better DAX code.
Row context is about the current row in a table. You run into this when you add calculated columns or use a function like SUMX. The computer does the math for each row of the table, one by one. For example, if you make a column Profit = Sales[Amount] – Sales[Cost], the formula looks at 'Amount' and 'Cost' from the row it is working on.
Filter context is not about the single row. It is about filters that be set in the data model right before a measure runs. These filters can come from slicers, charts, or other measures in your report. For example, if your measure is Total Sales and you click "2023" on a slicer, the filter context is "Year = 2023." The measure will now just sum the sales for all data that has this filter applied.
dax
15. Give a simple real-world example of a DAX calculation.
A good real-life example using DAX is making a "Year-over-Year (YoY) Sales Growth" measure. You will not find this business number in a raw dataset, but it gives new insights about how sales grow over time.
First, make a measure for total sales. You can use: Total Sales = SUM(Sales[Amount]). After that, make another measure to find sales from the same time in the last year. You can write: Previous Year Sales = CALCULATE([Total Sales], SAMEPERIODLASTYEAR('Date'[Date])). The CALCULATE function helps you get data from the last year.
At the end, you combine these to find the YoY growth rate. Here’s how: YoY Growth % = DIVIDE([Total Sales] - [Previous Year Sales], [Previous Year Sales]). This one DAX calculation lets you see how your sales do from year to year. It is a lot like a tableau calculated field because both use formulas to make new values from your data source.
16. What’s the difference between a dashboard, report, and page in Power BI?
In the Power BI world, the words dashboard, report, and page each mean something different. If you are at an interview, the person may want you to know what makes them different.
A report in Power BI is a file with more than one page. You put this together in Power BI Desktop. It has detailed charts and visuals about your data. You can use filters, slicers, and drills to work with it and dig deeper into your BI work.
A page is just one tab in your report. Each page holds different graphs or charts that look at a certain area of your data. For example, you may make one page to look at sales, and another to look at product details.
A dashboard is one page that you make in the Power BI Service. The dashboard shows the most important metrics or numbers at a high level. You build a dashboard when you "pin" visuals from one or more reports. There is not as much to interact with on a dashboard as you get with a report. But it is made for keeping track of top KPIs and going to your full report if you want to see more.
17. What are best practices for dashboard design in Power BI interviews?
If you are asked about best practices for dashboard design in a BI interview, for Power BI or Tableau, you should talk about keeping things clear, simple, and user-friendly. The main aim of any dashboard is to show the most important information fast and in a clear way.
Start by saying that a dashboard must be built for a clear audience and goal. You need to know who will use it and what questions they want to answer. This idea helps you make all other choices about the dashboard, like what the layout should be and which metrics you want to show. These main rules are the same for any data visualization tool.
Here are some best practices for a good dashboard design in data visualization:
Keep it Simple: Do not add extra stuff the user does not need. Use lots of empty space and only show the most important things. If there is too much on the screen, people will find it hard to use.
Top-Left is Key: Put the most important KPIs and key summaries in the top-left spot. Most people look there first.
Use Clear Labels and Titles: Every chart or metric has to have easy-to-read labels. This lets the user know what they are looking at with no extra explanation.
Ensure Consistency: Stick to the same color scheme and way of laying out visuals across the dashboard. This makes things look good and work well.
If you follow these simple points, power bi and tableau dashboards will show key
18. How do you select KPIs and plan dashboard layout in Power BI?
Choosing the right KPIs and planning how your dashboard should look starts with knowing the main goal of the business. Before you do anything, ask yourself, “What is the most important metric for the user to track?” It’s important to work with other people from the team to find the numbers that show success and help you make better decisions.
When you pick KPIs, look for the metrics that you can act on and that match up with the business’s needs. For example, don’t just show “Total Revenue.” A good metric would be “Revenue vs. Target” or “Year-over-Year Revenue Growth.” These metrics put the numbers in context and help you see how well things are going compared to a goal.
When you make the dashboard, it’s important to have a clear flow in mind. Most people start with top-level summary metrics and KPIs at the top of the dashboard. Right under these, you should show trend charts like line charts that let you see how things change over time. At the bottom, you can put more details or tables with extra info. This way, users can first get a simple overview and then look for more details if they want to.
19. How should you use color and storytelling in Power BI data visualizations?
Using color and telling a story with your data can change a simple chart into a strong and clear visual representation. The way you use these should always have a reason and help your main point.
When it comes to color, remember that less is better. Try not to put too many colors on your chart, because that can make it hard to read. Pick a color to make key data points stand out. Most data points should use a plain or soft color. Make one category or main trend pop with a bright color. It is also good to think about people who are colorblind. Choose colors for your data visualization that all users can see.
Telling a story with your data visualization helps you lead your audience to what you want to show. Lay out your visuals in a way that builds up your story. Start with a main view for your visuals. Then show the details that prove your main point. Titles, notes, and clear labels can help people understand what they see and why it is important.
20. What are common dashboard design mistakes tested in interviews?
Interviewers often ask about dashboard design mistakes. They do this to see if you know what not to do. They want to know if you can make dashboards that are easy to use and clear. If you want to give a good answer, talk about mistakes that hurt clarity and data accuracy.
One big mistake is putting in too much information. When you show too many charts and numbers on one screen, the dashboard gets messy. People can’t read it well. Good dashboard design means you have to choose the most important things to show for that view. Another mistake is picking the wrong chart, like using a pie chart when you really need to show changes over time.
Here are some common dashboard mistakes to talk about:
Inconsistent Scales: If you use different scales for charts that should be alike, it can be unclear and hard for people to compare. It also hurts data accuracy. You should always start the axis of your bar graph at zero.
Poor Color Choices: If you use a lot of bright colors or colors with no clear meaning, users will be confused.
Missing Context: Without titles, labels, or units, it isn’t clear what the data shows. Users are left guessing.
Ignoring the Audience: If your dashboard is too hard for most people or too simple for an expert, it won’t work well. Make it fit your user's needs.
21. How do you handle large datasets in Power BI?
Handling big data is very important for anyone who works as a data analyst. This comes up a lot in Power BI and Tableau interviews. When talking about this, make sure to talk about ways to make your dataset smaller and help your queries work faster.
One thing you can do in Power BI is filter your data before you load it. You can do this in the Power Query Editor. Remove any columns you don’t need and take out any rows that are not useful for your work. If your dataset is lighter, it will work better. You can also use summary tables or aggregations for your visuals, so you are not loading every transaction. This will help your Power BI or Tableau report run faster.
It's also good to use the right data types and keep your data model simple, using what is called a “star schema.” With a very large dataset, you could choose Power BI's Import mode with aggregation, or use DirectQuery mode. DirectQuery lets Power BI go right to the source instead of putting all the data into memory. You should use these methods for both Power BI and Tableau when you need to work with big data.
This way, you can handle large datasets, choose the right data types, and use aggregation to make your bi tool, like Power BI or Tableau, work well even with a bigger dataset. This will make your queries finish faster and give you a good result.
22. What steps would you take to improve Power BI report performance?
If a Power BI report is slow, people will not have a good time using it. Making reports faster is very important in data analytics. The best way to do this is to follow each step, one by one. Start by looking at the data model. If the data model is hard to follow, with many tables and a lot of relationships, this can cause things to slow down.
Making the data model simpler often helps the most. You should take out any columns that you do not need. Try to use a star schema in your Power BI report. Stay away from bi-directional relationships unless you must have them. Also, make sure your DAX is written to be quick. As an example, it is better for speed to use measures instead of calculated columns. This is true especially for numbers that need to be added up or counted.
Paying attention to how many visuals are on a page is also important. For each visual that you add, another query goes out to the data model. If there are a lot of visuals, the page will load more slowly. You can turn on Power BI's Performance Analyzer tool to see what is taking the most time. Use this tool to find the slowest visuals or slowest queries. Then, you can put your focus on making those faster in your analytics and bi projects.
23. How do you manage data refresh failures in Power BI?
Data refresh failures can stop your business intelligence work. So, it is important to learn how to fix them. When a scheduled data refresh fails in the Power BI Service, the first thing to do is check the refresh history for an error message. This message will often help you know what went wrong.
The most common reason is a problem with your data source credentials. If a password has changed or run out of time, the refresh will stop. Another reason could be something is wrong with the on-premise data gateway. Make sure the gateway is running, online, and set up right. It needs to link Power BI Server to your data sources in your workspace.
Some other things that can make data extraction not work: the data source could have changed a column name or deleted one, there may be errors in your Power Query steps, or there may be trouble with your internet connection. To fix refresh failures, you have to check each part: the data source, the gateway, and then the settings on Power BI Service. Be sure to go step by step, so you can find and fix the problem fast.
24. What would you do if a Power BI visual shows incorrect results?
Making sure data accuracy is right is very important in data analytics. When you see a visual that is showing wrong results, you should check everything step by step. The main reason is often in the data or the logic behind the visual, not with the visual itself.
First, look over the DAX formula you use to measure in the visual. Even a small mistake in the logic can change the results a lot. Next, you need to check how your tables are linked in your data model. If a relationship is not set up right or is not active, data may get filtered or added up in the wrong way.
If both the DAX and the relationships look all right, then you should see which filters are on the visual. This means checking slicers, filters on each page, filters for the whole report, and also any filters coming in from other visuals connected to it. If you still do not find the reason, go look at the source data in Power Query Editor. Check that you have brought over and changed the data the right way and make sure there are no null values or errors in data types that could make problems.
This is how you work towards better data accuracy in analytics.
25. How do you explain dashboards to non-technical business users?
When you talk about business intelligence or a dashboard with people who do not work with tech every day, you need to keep things simple. Focus on what the dashboard shows and why it matters. There is no need to talk about DAX or how data gets to the screen. People just want to know what all that information means for the business. The best way to do this is with easy words and a simple story.
Start by telling them why the dashboard is here. Share what it is for and what questions it can answer for the team. You can say, “This dashboard gives us a quick look at our sales every day. It also shows us which products do well.” Keep away from tech words that might confuse someone.
As you go through each part of the dashboard, show them what is on every piece in plain words. If you see a chart or card, instead of saying, "This is the total of all our sales in DAX," say, “This number is the total sales we made this month.” Always tie the numbers or charts back to their role or company goals. Let them see how this tool can help them at their job.
When you do this, everyone can see why your business intelligence dashboard is worth their time. It becomes clear, useful, and something people want to use.
26. What is incremental refresh and when should you use it in Power BI?
Incremental refresh is a feature in Power BI that helps make data refresh faster for big datasets. You do not have to bring in all the data every time you run a refresh. Incremental refresh splits up the data and only brings in new or changed data. It shows up a lot in bi interview questions or when people ask about power bi for big data.
You will want to use incremental refresh if your data model is very big and it slows down when you refresh. Let's say you have a sales table. It might have millions of rows for many years. If you refresh all of it each day, it will take too much time. The data from older years will not have changes.
With an incremental refresh policy, you can have Power BI import just the new data from recent days or weeks. Older rows will stay as they are. This way, refresh times get shorter, and you use less of the computer's power and less space in Power BI. Your reports will show newer data faster and more often.
This method works well for any big dataset and is a good topic to know for your next BI interview questions.
27. How does Row-Level Security (RLS) work in Power BI?
Row-Level Security (RLS) is a feature in Power BI that helps keep your data safe. It lets you decide who gets to see what, so people only see the data that matters to them. With RLS, you don't need to have many copies of the same Power BI report for each group. You use one report, and RLS controls the subset of data that each person can look at.
RLS uses filters at the data model level to make this work. You set up "roles" in Power BI Desktop. For every role, you make a DAX rule that tells Power BI how to filter the data. Let’s say you have a "Regional Manager" role. You can make a rule that looks like [Region] = USERPRINCIPALNAME(). This checks if the user's email is for the right region.
When someone opens the report in the Power BI Service and they have that set role, the RLS filter goes on right away. Now, they can only view the rows and data values that match their role’s filter. This is a good way to use bi to keep private data safe. It helps make sure only the right people see some parts of the data.
28. What are Power BI gateways and how do you schedule data refreshes?
A Power BI gateway is software that helps keep your data safe. It works like a secure bridge between your company’s data (that sits on your own network) and the Power BI Service in the cloud. This lets the cloud reach your data on-site for things like data refresh.
You need a gateway if your report pulls data that’s not in the cloud already. After you put the gateway on a server in your office that’s always up, you can set up your datasets in Power BI Service to use it. This lets Power BI send queries right through the gateway. It’s how the service gets to your inside database in a safe way.
If you want your data to refresh on a schedule, go to your dataset’s settings on Power BI Service. Look for the "Scheduled refresh" section. Here, you can turn on refresh, choose how often it runs (like daily or weekly), and pick the time when you want it to update. Power BI will then use the gateway you set up to keep your dataset up to date with the schedule you made.
29. What performance optimization techniques do you use in Power BI?
To make Power BI work better, I use more than one method. I focus on the data model, DAX steps, and how the report looks. This way is very important for making fast BI reports that work well. These methods often come up in higher-level Power BI and Tableau talks.
First, I get the data model ready. This is the most important part. I start by taking out the columns and rows I do not need in Power Query. I use a star design and keep relationships between tables simple. I also make sure the data types are right. If the model is light, the report will go fast. I use aggregation, which means I group the data in summary tables so the report does not have to handle too many rows.
Next, I write good DAX steps. I choose measures, not calculated columns, when I need to add things up. I use VAR to name values in hard formulas. This makes my DAX simple and helps it go faster. For the last step, I make the report better by keeping the number of charts on one page as low as I can. I use Power BI’s Performance Analyzer tool to spot and fix things that slow the report down. The same kind of topics show up in Tableau, like context filters, data extracts (TDE/Hyper), and making sure the steps are smooth.
[Keywords: power bi, data types, tableau, bi, aggregation, dax]
30. How do you deploy reports to the Power BI Service?
Deploying, or publishing, a report from Power BI Desktop to the Power BI Service is a straightforward process that makes your reports accessible to a wider audience. This is the final step in the development workflow before sharing and collaboration can begin.
The primary method is to simply click the "Publish" button on the Home ribbon in Power BI Desktop. After you click it, you'll be prompted to sign in to your Power BI account and then choose a destination "workspace" in the Power BI Service. A workspace is like a folder where you can store related reports, dashboards, and datasets.
Once published, you can access the report through your web browser by navigating to the Power BI Service. From there, you can perform further actions like creating a dashboard, setting up a refresh schedule, or sharing the content with colleagues.
Step | Action | Description |
|---|---|---|
1 | Finalize Report | Ensure your report is complete and saved in Power BI Desktop. |
2 | Click Publish | On the Home tab in the ribbon, click the 'Publish' button. |
3 | Select Workspace | Choose the destination workspace in the Power BI Service. |
4 | Confirm | Power BI will upload the .pbix file to the selected server location. |
5 | Configure in Service | Open the report in the service to share or set up a data refresh. |
31. How does SocialPrachar prepare candidates for Power BI interviews (real-time dashboards, DAX interview questions, mock interviews)?
SocialPrachar gives training that helps you get ready for a real job interview in data analytics. The classes do not just teach ideas. They focus on the real skills that recruiters want to see. This is why many people pick SocialPrachar if they want an AI engineering course in Hyderabad.
The way SocialPrachar teaches is hands-on. You get to make real-time dashboards and do projects like the ones you will see in a real business. Doing these projects helps a lot. They give you good stories to share during your job interview. No matter if it's for Power BI or Tableau, you will be able to talk about your work in a clear way. You will also learn how to use the STAR method (Situation, Task, Action, Result), which helps you explain your projects step by step. Their mock interview practice lets you get better at this.
SocialPrachar puts a lot of time into helping people get jobs. You will be ready for any test that comes your way.
Interview-Focused DAX Training: You will learn how to answer hard DAX interview questions for advanced data analysis.
Real-Time Dashboard Projects: You will make a portfolio that shows how well you can create strong dashboards.
Mock Interviews & Case Studies: You will have the chance to work through tough, real-life job interview questions while getting support.
Comprehensive BI Skill Development: As a top AI school in Hyderabad, SocialPrachar teaches all parts of BI. This includes data
Conclusion
To sum up, learning Power BI is very important if you want to do well in data analytics jobs. When you get to know the most asked interview questions—from basic things about Power BI to working with DAX and dashboard design—you show you know the subject. It also helps to have real experience, to get how data modeling works, and to talk about your own projects in a clear way. These things help you stand out when you meet with interviewers. If you want to get better at interview questions and raise your confidence, SocialPrachar gives great training for Power BI interviews. Their training covers hands-on projects and practice interview sessions. If you want to get ready the right way, book a free consultation today!
Frequently Asked Questions
What are the most asked Power BI interview questions?
The interview questions for BI often ask you about the difference between measures and calculated columns. You will get questions on row and filter context in DAX. The person interviewing you may ask about the best ways to build data models, like using a star schema. They can also give you some real-life problems about how to make things run better and faster. You will need to talk about your project experience and explain what you did in detail.
These are the kinds of BI interview questions you should get ready for. Knowing about DAX and ways to make your work in BI stronger will help you do well.
Is DAX mandatory for Power BI interviews?
Yes, if you want a good job in Power BI, you need to know DAX well. It is not just for making simple reports. DAX lets you build custom metrics and do strong data analytics. It also helps you solve hard business problems. You can be sure that interview questions for BI roles will check how much you know about DAX.
How does SocialPrachar help with Power BI interview preparation?
SocialPrachar gives you hands-on training with real-time projects on dashboards. You also get focused sessions where you learn to solve tough DAX interview questions. There are even mock interviews to help you get better practice. Their approach is all about helping you get ready for jobs, so you build a strong portfolio and feel confident to do well in any analytics interview.