


What Is Predictive Analytics? Insights and Future Trends
Key Highlights
Predictive analytics uses historical data, machine learning, and data analysis to estimate future outcomes.
Businesses use predictive models to improve planning, reduce risk, and support faster decisions.
Common methods include linear regression, time series, decision trees, neural networks, and automation.
It goes beyond reports by showing what may happen next, not just what already happened.
Industries like healthcare, finance, retail, and supply chain rely on it every day.
In 2026, it is becoming a core part of AI-driven business intelligence.
Introduction
Predictive Analytics uses historical data to help you make better guesses about what might happen in the future. It is a part of modern data analytics. You can also see it work with artificial intelligence to spot good patterns much faster than a person could by hand. That is why students, analysts, and business leaders keep asking, What is Predictive Analytics? Benefits and use cases are important since these shape their decisions. If you want an easy way to see how Predictive Analytics works in 2026, and why it matters, this guide will walk you through it step by step.
Understanding Predictive Analytics
Predictive analytics is part of data science. It uses past and current data to guess what could happen in the future. It looks for trends, patterns, and other signs that can help with business and work decisions.
To get these answers, teams use things like classification models and regression models. These tools can change raw information into useful predictions. This can help you go from just guessing to making smart choices. The next parts will explain this idea in everyday words and show how it works in real life.
Defining Predictive Analytics in Simple Terms
Think of predictive analytics as a smart way to use what you learn from the past. This helps you get ready for what may happen in the future. It looks at data points from things that happened before and uses them to guess future events. Instead of just telling you what happened, it gives you an idea of what is likely to come next.
In real life, data scientists find patterns in customer behavior, how things work, or what goes on in the market to build models. These models are not magic. They find links in the data and give you actionable insights your team can use.
For example, a company can look at order history, the time of year, and customer behavior to guess what people might buy next month. Managers can use this to better plan inventory, staffing, and budgets. This is what predictive analytics is all about and why it matters.
How Predictive Analytics Works: The Basics
Predictive analytics begins when a business collects data. The company gets historical data from places like sales tools, customer records, spreadsheets, or logs. After this, it organizes and cleans all that information so it is easy to use.
Next, it uses data mining and machine learning. These steps let people find patterns in large data sets that most would not notice on their own. If certain things keep happening before something else, the model will learn this and use it to guess future outcomes.
When the model is tested, the company can use the results in real business operations. It could be used to predict demand, look for fraud risk, or see which customers might leave soon. All this helps people act earlier, make better choices, reduce waste, and stop guessing by using good information.
Comparing Descriptive, Diagnostic, Predictive, and Prescriptive Analytics
Not all analytics answer the same thing. Some ways look at the past, and some help you know what to do later. If you compare the leading types of data analysis, predictive analytics is between understanding what happened and knowing what to do next.
Here is a simple breakdown:
Descriptive analytics shows what happened before.
Diagnostic analytics explains why it happened.
Predictive analytics tells what may happen in the future.
Prescriptive analytics tells you the best thing to do next.
Real-time analytics shows what is happening now.
This makes a difference in business. Most reporting sticks to information about the past. Predictive analytics does more. It uses data from the past and current data to guess about what will happen later. Prescriptive analytics takes it further and gives advice on what steps to take next. When you use these types of data, leaders get a better view of what is going on and what to do next.
Real-World Example for Beginners
A simple example for beginners is online shopping. An e-commerce site looks at what people click on, what they bought before, and how they move through the site. With that history, predictive analytics suggests things a shopper might want to buy next.
You can see this with marketing campaigns, too. Teams look at how people replied before, when actions happened, and who they talk to. This helps them guess which people might open an email or answer an offer. That way, they can send better marketing campaigns instead of sending the same message to everyone.
Another easy case is fraud detection. A bank checks spending behavior and finds activity that does not fit normal patterns. These tools give more accurate predictions as they learn from new deals. That is why predictive analytics is a part of things many people use every day.
Importance of Predictive Analytics in 2026
 In 2026, predictive analytics is important because the markets move fast. There is more data than ever. People in charge need to make the right choices using data. No one wants to wait too long to act. They want to see early signs of what might happen in the future.
This change gives companies a real competitive advantage. They use predictions to lower risk, plan better, and find good moments before others do. With AI and new analytics tools, teams cannot ignore predictive analytics now. In the next parts, you will see how this adds value in the work people do every day.
Data-Driven Decision Making with Predictive Analytics
Good decision-making depends on the right time and clear proof. Predictive analytics helps by changing large amounts of information into actionable insights before problems get bigger. You do not have to wait for past reports. Instead, you can use patterns to guess what will happen next.
This makes data-driven planning easier to use. Through data processing and data analysis, businesses can look at trends, check their thoughts, and measure what is likely to happen. For example, a retailer can estimate demand before a busy season. They do not need to wait for stockouts to take place.
This type of help is good for all teams. Finance can look at risk. Marketing can guess how people will respond. Operations can plan their staff and inventory. When leaders know the way an issue may go, they can act sooner and with more trust. This is the way predictive analytics gives support to better decision-making today.
AI-Powered Forecasting Models for Business
Yes, forecasting models play a big part in predictive analytics. In 2026, many of these models use AI, which works faster with large and complex data than old ways. These new tools help people guess future events like sales, customer drop-off, or troubles in daily work.
Time series methods are often used when data comes with dates or follows seasons. Businesses study things by the week, month, or hour with these models. Neural networks and deep learning also come into play when the data is hard to read and there are many hidden links.
All these ways help people run businesses in a way that's not stuck. A finance team can guess their income. A call center can figure out how many calls will come each hour. A store can prepare for holidays by planning its stock. The type of model you pick will depend on what you want to solve, but the main goal is always the same: better plans for the future.
Risk Reduction and Revenue Optimization
One big reason that many companies put money into predictive analytics is clear. They want to lower their losses and get better returns. When teams use data analytics to find patterns early, they can cut down on guesswork and make smarter choices with money.
It helps protect and grow the business at the same time:
Banks use these models to see credit risk before they give out loans.
Security teams use pattern checks to spot strange actions.
Retailers use forecasts to get better prices and control costs.
Making more money can be easier if you know what your buyers want, how much they are worth, and who might leave soon. Businesses can put more money into the best chances and stop wasting cash. Leaders can also lower risk by getting ready for late payments, scams, or supply trouble ahead of time. Having a plan for problems and chances to grow is one of the best things about using these tools.
Gaining Competitive Advantage with Analytics Tools
Companies that use predictive analytics tools in the right way often move ahead of others. They can act sooner when there are changes in demand or in customer behavior. They also see when costs go up or down. This helps give the company a big competitive advantage in markets where there are many trying to win.
It is not just about the teams with tech skills. The new analytics tools and dashboards help business users too. They give simple reports and easier ways to get work done. So, more people can use forecasts for planning, sales, and operations. No one has to wait a long time for reports anymore.
Because of this, companies can get better operational efficiency and have stronger marketing strategies. They can find the right people for their ads, get ready for busy or slow times, and make service better—all at once. By 2026, being quick to act on predictions is a big reason why predictive analytics tools are so important.
Step-by-Step Process of Predictive Analytics
The predictive analytics process has a few clear steps. First, you need to know what problem you want to solve. Next, you collect the data you need. After that, you clean the data. Then, you build a model. You test what comes out of the model and use those results in your real work. Sticking to this order helps keep predictive analysis on track.
Good data preparation matters a lot. Using statistical modeling the right way is also key to getting good results. If the data is not strong, your forecast will not be strong either. If you do these steps well, the process helps with business intelligence. It turns complex information into choices your team can use. Here is a simple look at the workflow.
Data Collection and Preparation
Everything starts with data collection. Teams get information from many places. They gather data from databases, ERP systems, spreadsheets, emails, logs, and records from customers. The idea is to bring together all important information that has to do with the problem the business wants to fix.
Most raw data is not simple to use. The data may have missing values, extra records, strange things, or things that do not match up. Some of it may be unstructured data, like text or pictures. This type of data takes more time and care before it is ready.
This is why data preparation is so important. Analysts clean the records, fix mistakes, organize different parts of the data, and make everything ready to use in models. If you want to start learning about predictive analytics, you need to know how to do this. The best results come from data that is clean, useful, and put in order from the start.
Statistical Analysis and Model Building
When the data is ready, the next thing the team does is statistical analysis. This helps people understand the links, trends, and signals in the data before they try to build anything big. It is at this point that teams test what they think they know. It also helps them spot the variables that matter most.
After this, data scientists start with predictive modeling. The team picks tools that fit what they want to do. They may use regression models if the outcome is a number. Or they use other ways if they are sorting data into groups. Picking the model is never random. It depends on the business task, the look of the data, and how exact the team needs to be.
This step helps teams make good choices because it takes data trends and turns them into a working system. When a model is made, it can guess things like sales, churn, risk of fraud, or when to do fixes. If leaders see what might happen before it does, they can give out resources and plan money and actions better. This works much better than just looking back at old numbers.
Generating Predictions and Continuous Improvement
Once the training is done, these predictive models start giving you results that the team can use. You will see these predictions in dashboards, apps, reports, or even as alerts. The real thing here is not just about making a model. It's about giving a good look into future outcomes, so you can make better choices each day for the business.
But, you cannot just build a model and walk away. Business goes through so many changes, and customer behavior keeps shifting. There is always new data to work with, too. So, keeping things fresh and checking in on your model matters a lot.
Good teams usually:
Compare predictions with what really happened
Retrain models with new data as it comes in
Change up the features when customer behavior or patterns shift
Track how correct things are over time
This whole process is what makes the model keep working. For example, if a shop sees their demand changes after a season, it must rework the forecast. Predictive analytics is at its best when it keeps learning and making better guesses as things in the world or in your business change. It helps to always improve your forecast future outcomes as you go.
Practical Business Intelligence Example
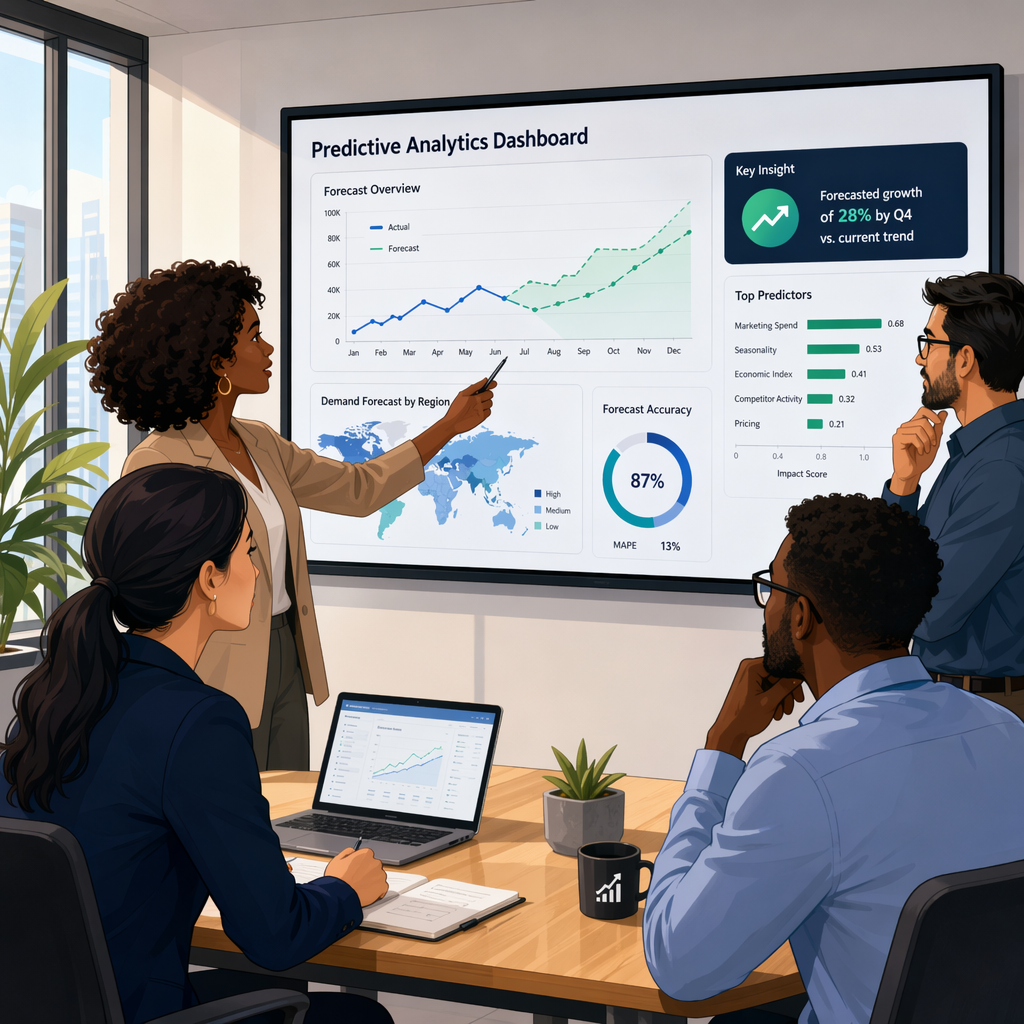
Picture a store manager using a business intelligence dashboard. The manager can see old orders, stock counts, and how long things take to ship out. Regular reports tell you what items sold last month. But predictive models use the same data to guess what people will want to buy next week or even next month.
This can make a big difference in supply chain management. If the model thinks there will be higher demand in an area, managers can send more stock early and not miss sales. If lower demand is expected, they can keep from having too much stock and save money on storage.
The main idea is that predictive analytics goes beyond normal data analysis. Predictive tools do not just help teams look at past sales. These tools let you forecast future outcomes. In business intelligence, this lets teams plan ahead, move fast, and get ready for what may come next in the supply chain.
Forecasting Models Used in Predictive Analytics
Forecasting models help drive predictive analytics. They look for patterns in the data to guess what might happen next. You can use these models for things like sales planning, fraud detection, or demand forecasting. You need a different method for each problem.
The most common machine learning techniques are linear regression, time series models, decision trees, random forest, and neural networks. Each one has its own way of working. Each has things it does well and the best time to use it. The next sections will show how these machine learning techniques compare. The goal is to use simple words so you will know when to pick which tool.
Linear Regression, Time Series Forecasting, and Decision Trees
Linear regression is one of the easiest regression models you can use. It helps you guess a number by looking at how one or more things are tied to what you want to find out. For example, a team may use linear regression to guess a salary, demand, or how much money will come in, using things they already know.
Time series models are made for data that goes by date. They check things that happen across time and are helpful for looking at things like how many calls come each hour, sales each month, or changes in demand when it's a certain season. In data analysis, this is a great pick if you care about when things happen or how things change during the year.
Decision trees work in a different way. They ask questions one after another until you get a result, just like moving along branches of a flowchart. These models are simple to understand and you can use them for both groups or numbers. Most businesses like decision trees in data analysis because it's much easier to tell how they got to an answer.
Linear regression, time series, and decision trees are some of the best regression models in data analysis.
Random Forest, Neural Networks, and Machine Learning Models
Random forest is a newer way to use decision trees. It does not use just one tree. Instead, this model brings many trees together. The goal is to get more stable and correct answers. Because of this, it works well for tasks in machine learning, like sorting things into groups or checking for risks. One tree might make mistakes easily, but a group of trees can be better.
Neural networks work well in data science when things get tough and patterns are not easy to see. They are often linked to deep learning. This is because they can deal with a lot of details at once, like looking at pictures, understanding voices, or looking for something hard to spot in lots of data.
Models from machine learning like these help people do more with what they know about the future. For example, a bank can use random forest when it checks for fraud. A store can use neural networks to show you what you might want to buy next. To pick the right model, you have to look at your data, what you want to do in your business, and if you want things explained or just want good results.
Purpose, Advantages, and Use Cases of Each Model
Choosing among forecasting models gets easier when you compare their purpose and strengths side by side. Some are easier to explain. Others handle complexity better. What matters is matching the model to the business problem.
Here is a simple text table:
Model | Main purpose | Advantage | Typical use cases |
|---|---|---|---|
Linear Regression | Predict numeric outcomes | Simple and clear | Sales, pricing, revenue estimates |
Time Series | Forecast over time | Handles seasonality | Demand, call volume, inventory |
Decision Trees | Rule-based prediction | Easy to interpret | Approval logic, customer groups |
Random Forest | Improve tree accuracy | More stable results | Fraud detection, risk scoring |
Neural Networks | Learn complex patterns | Strong with large data | Recommendations, image or voice data |
In business operations, the right model can improve planning, fraud detection, and supply chain decisions. That is why understanding model purpose is as important as learning the technical name.
Role of Statistics in Enhancing Predictive Analytics
Statistics is the base of predictive analytics. Without the use of statistics, models in data analytics would just be guesses. Things like probability, correlation, and regression help people who work with data. These tools let you check patterns and see how sure you can be about the results.
This is important. Good predictions need strong logic behind them. It is not only about using one kind of software or another. In the world of data analytics, statistics lets you check if a trend truly matters, if things connect well, and if a model is strong enough to help a business choose what to do next. The next parts will talk about these things in simple words.
Probability, Correlation, and Hypothesis Testing
Probability helps you figure out how likely something will happen. In predictive analytics, this can show the chance of a customer leaving, a payment being fake, or if demand will go up next month. It does not give a sure answer, but it points you in a good direction.
Correlation checks if two things move together. For example, you may see in historical data that demand goes up at the same time each year, or that response rates change by when you send a campaign. This is a big part of statistical modeling because it helps you see which things matter most.
Hypothesis testing helps you stay on track. It helps you find out if a pattern is real or just by chance. If you are just starting out with predictive analytics, these ideas are very important. They help you build models with a strong base that you can test and trust.
Trend Analysis and Regression Techniques
Trend analysis helps you see which way things are going over time. For example, if sales go up every holiday season or you get more support calls on some days, these things are important to notice. When you look at data points through the year, your team can use this to plan better and not just guess.
Regression techniques explain why things move the way they do. Linear regression is very good when you want to know how one thing has an effect on another. Because of this, regression is an important part of business planning and looking at what will happen next.
These methods help you:
See market trends in a much clearer way
Measure how much things go together or change each other
Use old patterns to make better forecasts
If you are just starting, this is a good way in. You do not have to know much or build big models at first. If you get trends, learn about variables, and see their links, you will have a good starting point for work that looks ahead.
Improving Prediction Accuracy with Statistical Foundations
Better reasoning helps make better models. In data science, teams use statistical analysis to pick the right variables. They also use it to check ideas and stop mistakes that can happen from confusing data. This careful work helps models guess results better even before advanced tools are used.
Model validation is very important in data science. A model needs to be checked by comparing it to real results. If the results are not strong, people change the design, features, or training process. This is done before using the model for real business choices.
This helps show why predictive analytics is so valuable. It is not just about coming up with a number. The work is to make a result that is double-checked and improved over time. Good regression models and solid statistics help people trust and use forecasts in their work.
Predictive Analytics vs Traditional Business Intelligence
Traditional business intelligence helps you see what happened in the past. It puts reports, charts, and dashboards in order so your team can check how things went and learn about past results. That is helpful, but most of the time, it does not go beyond that.
Predictive analytics looks ahead. It uses data analysis, tools, and automation to guess what could happen next. You can say that business intelligence lets people see what has happened, while predictive analytics helps people see what might come. Each of them is useful, but they do not have the same job. The next parts look at how they help, how they use data, and what kind of value they give for making choices.
Purpose and Data Usage Comparison
The main difference between business intelligence and predictive analytics is why you use each one. Business intelligence helps you watch and share what has happened. Predictive analytics is for figuring out and acting on what may happen. One helps you look back at what went on. The other helps you think ahead.
The way they use data is not quite the same:
Business intelligence usually gets structured data from data warehouses.
Predictive analytics uses old and current data together.
Many times, predictive work needs big data from more places.
It can also add different kinds of inputs if the business question needs it.
This does not mean that one is better. They each do a different job. If you only want to know how things went last quarter, business intelligence works well. If you want to guess what could happen next quarter or how many customers you may lose, you should use predictive analytics.
Decision-Making Approach and Forecasting Ability
Traditional reporting helps people in business operations make choices by looking at results after things happen. Leaders use this to see trends over time, check where things stand, and spot problems. It’s helpful, but teams often act late because of it.
Predictive analytics makes a change in timing. It lets people look ahead, not just back, by saying what could come next. When you use this with data that comes in right away, it helps people to plan better and act fast.
This difference really matters for business operations. A group that handles orders can get ready before the need for products goes up. People in finance can see risks sooner. Marketing can spot customers that may leave before they go. Both ways help do the work, but predictive analytics gives teams a better shot to act early, not just after things are done.
Automation Levels and Extending Business Intelligence
Business intelligence usually needs regular reports, updates on dashboards, and people to look at and understand the data. Predictive analytics brings in more automation. With these models, the data can be scored, forecasts get updated, and alerts go out with less work from people.
This does not take the place of business intelligence. It adds to it. Predictive analytics models use the same ideas and tools as business intelligence, but they help with new, forward-looking advice. Good data management pulls both areas together. It helps the insights help all parts of business.
For a lot of companies, this is where the main value is. They keep their dashboards. But now, they get actionable insights about customer behavior, demand, and risk. In this way, predictive analytics is not different from business intelligence. It is the next step forward.
Practical Use Cases Across Industries (India Focused)
 Predictive analytics shows up in many types of jobs. Most industries face a common problem. They all want to make better choices before small problems turn into big ones. You can see it in healthcare and in stores. Groups use it to plan ahead, cut down waste, and act early.
The same idea works for companies in India too. Here, businesses use data to do things like improve lending, plan for demand, find the right customers, and make the supply chain work better. The topics below show how predictive analytics brings real value in daily work and in things people see and use every day.
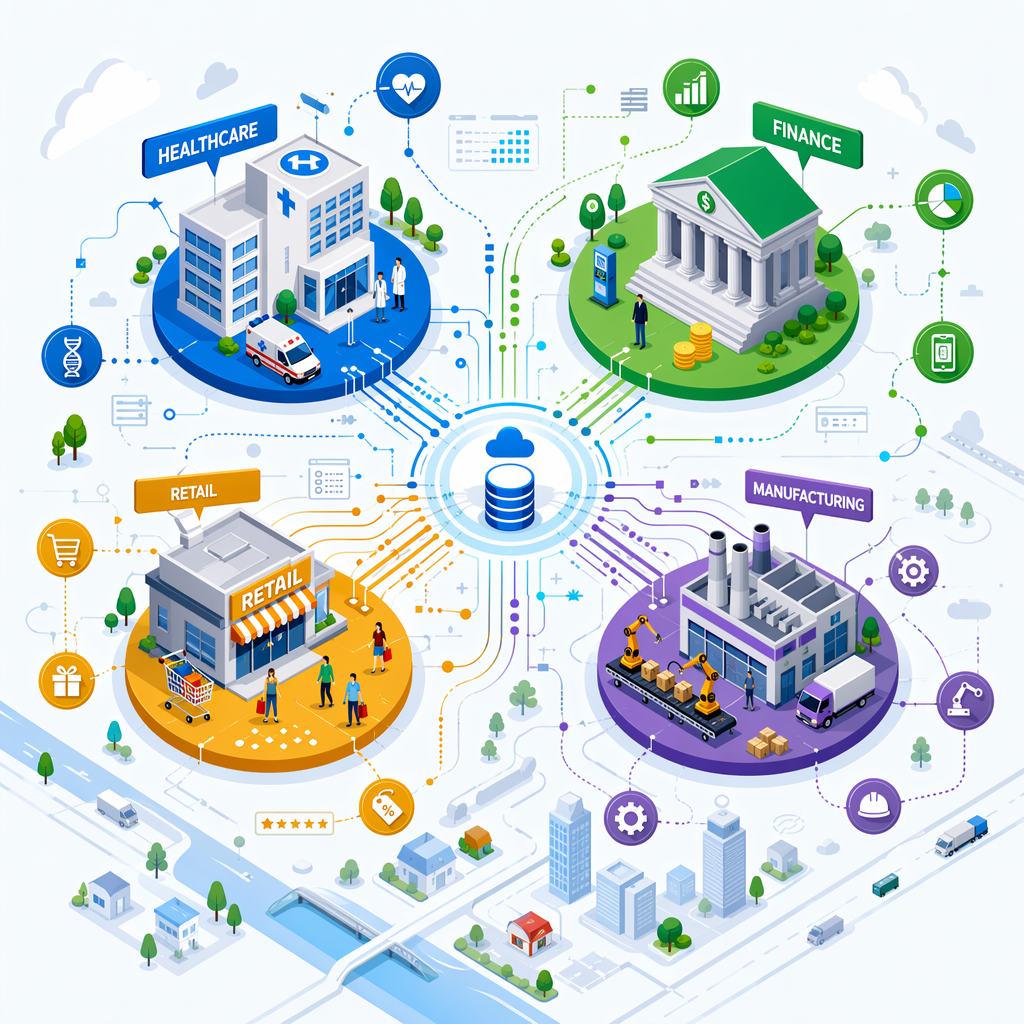
Healthcare, Finance, Retail, and Manufacturing Applications
Some of the best predictive analytics use cases are found in key industries. These fields deal with a lot of data and often have to make quick, repeatable choices. That is why forecasting is so good for them.
Common use cases include:
Healthcare: predicting if a patient is at risk, finding infection patterns, or guessing patient outcomes
Finance: scoring loans, checking credit risk, and doing fraud detection
Retail: guessing demand, planning stock, and helping with prices
Manufacturing: knowing when a machine needs fixing and boosting product quality
Each example helps fix a real business problem. A hospital can spot high-risk patients faster. A bank can see strange activities. A retailer can avoid having too many products in stock. A factory can tell if something will break before it stops work. These are all things people can use right now. That is why more and more people choose to use predictive analytics.
E-commerce, Marketing, and Education Examples
E-commerce is the best place to see predictive analytics work. Online sites look at your browsing, what you buy, and what you click on. They use this to show you products you may want and to guess what you might buy next. This helps improve customer satisfaction and also helps more people finish their shopping.
It also helps in:
Marketing campaigns by guessing if someone will respond or stop using the service
Education by noticing patterns that can change student results
These are good examples because they lead to action right away. A marketing team can change who to target before spending too much money. Schools can spot signs that a student may need more help. With these predictions, people can act sooner. That is what makes predictive analytics strong for both customer service and service jobs.
How Indian Businesses Leverage Predictive Analytics
Indian businesses use predictive analytics to help with timing and accuracy, just like others around the world. The biggest impact can be seen in the retail, financial services, e-commerce, and areas where operations matter a lot. In these places, everyday choices about what to do can change costs and growth.
Supply chain management works better when businesses can guess demand in each area, at different times of year, or across types of products and sales. Marketing strategies are stronger when teams can spot customers who might buy soon or know which people might leave. These ways of using data help people act fast.
This tends to give companies a competitive advantage. They can cut down on waste, make better plans, and react fast as customers ask for new things. While the company or field might change, the idea is always the same. Look at old and fresh data to decide what to do next, so the next business move is a smart one.
Predictive Analytics Tools and Technologies
To use predictive analytics, you must have the right machine learning and analytics tools. These tools help you clean raw data, build models, show your results, and share them with others. Some tools use code, while others are easier to use and better for people in business. The tool you pick should fit what you want to do and how much you know about data science or programming.
Some predictive analytics tools used by many people are Python, R, SAS, RapidMiner, Power BI, Tableau, and Azure Machine Learning. They help with every step, from working with raw data to making dashboards. In the next parts, you will see what each tool does, where to use them, and how easy they are for new users.
Python, R, SAS, and RapidMiner
Python and R are known for how well they handle data analysis and building models. Many data scientists and analysts use them to clean information, test out models, and run forecasting steps. SAS has been used for a long time by businesses for analytics, while RapidMiner gives people a visual way to build models.
A simple view:
Python: popular, flexible, and great for machine learning
R: good for working with statistics and deep data analysis
SAS: made for big companies and works well with organized data analytics
RapidMiner: makes model building easy with its visual workflows
Learning each tool can feel different. You might find Python is easier for many jobs. R can be better for deep statistics tasks. SAS is often used by big companies. If you want to do less coding, RapidMiner could work for you. Pick the analytics tool that fits best with how much flexibility, statistical focus, company scale, or low-code experience you want in your work.
Power BI, Tableau, and Azure Machine Learning
Some tools are made mainly for sharing results and business use. Power BI and Tableau are known for making good charts and graphs. They help teams show results in a way that people can see quickly. Teams can turn numbers into pictures, dashboards, and easy-to-read reports. This helps groups who need to decide what to do next.
They are often used for:
Power BI: reporting, dashboards, and business tracking
Tableau: visual storytelling and looking at trends
Azure Machine Learning: making and using models on a large scale
These predictive analytics tools and machine learning platforms often work better when used together, not alone. A team might build a model in Azure Machine Learning, then show the results with Power BI or Tableau. For people just starting out, Power BI and Tableau are more simple to pick up and use. Azure Machine Learning is best for strong modeling work and when you want things to run in the real world.
Choosing the Right Analytics Tool for Business Intelligence
Picking the right analytics tool starts with what your business needs. Do you need dashboards for business intelligence? Do you want a coding area for data science? Or are you looking for a platform that can do both modeling and reporting? The answer will help you know which tool to pick.
You should think about your team’s skill, the budget you have, and how big your data is. Some machine learning and data science tools work better with large data sets. Others give you fast dashboards, or make simple modeling easier. The best practice is to start with the problem. Then, choose the tool that will fix it in the best way.
If you have a business-focused team, Power BI or Tableau can work well in the beginning. If your team spends a lot of time building models, you may want Python, R, or Azure Machine Learning. The best setup often brings together analysis, forecasting, and sharing your work in one simple workflow.
Benefits of Predictive Analytics for Modern Organizations
The main benefit of predictive analytics is easy to understand. It lets you act sooner. Teams do not have to wait until problems show up in reports. They can use what they get from data to get ready before anything gets bad.
This helps you decide better. It makes things run smoother. It also gives customers a better experience in many parts of the business. Teams can use it to bring down risk, keep costs under control, and help a company grow. Today, that matters a lot. Acting fast, even by a little, can turn into bigger wins for the business. Now, let’s go over what these benefits look like with real examples.
Better Decision-Making and Increased Efficiency
Predictive analysis helps you make better choices by letting you see ahead. Teams can look at the outcomes they might get before they give their time or money. This is not the same as just using old reports, which only show what happened in the past.
It also brings more speed to the everyday work:
Teams can plan for stock, staff, and budgets sooner.
Managers can stop slowdowns and fix process issues.
Operations can move faster when customer needs change.
These changes boost operational efficiency in different parts of the company. In data analytics, value comes when you take action because of the insights you find. If a company knows demand could go up next month, it can get its inventory ready now. If a support team knows they may get more calls, they can plan the schedule better. Being ready sooner means things run easy and business gets better results.
Reduced Risks, Improved Customer Experience
One of the main benefits is risk reduction. Companies can spot warning signs of fraud, missed payments, service problems, or low stock in their supply chain before they become big issues. This means teams can act fast, so they do not wait until after trouble has started.
The same thing helps improve the customer experience. By looking at customer data, businesses can suggest products people want, help when it is needed, and fix things before the customer feels upset. This makes every message or help feel just right and on time.
It is also good for supply chain planning. If a business knows ahead of time about a delay in shipping or that something will run out, it can change plans right away. Customers are less likely to feel the trouble. So, predictive analytics is much more than just a tool for numbers. It helps companies be reliable, give better service, and earn trust. Knowing what will happen next often creates a better experience for the customer.
Cost Optimization and Sustainable Competitive Advantage
Costs go up for businesses when they buy too much stock, hire people late, miss out on risks, or spend money on marketing that does not work. Predictive analytics helps cut down on these costs by making resource allocation better. When you can guess what might happen, you can plan more exactly.
This helps with cost optimization in all parts of business operations. For example, retailers can bring down extra stock. Logistics teams can fix slow or wasteful routes. Finance teams can look at risks sooner. A few small steps in better choices can add up to real savings.
Over time, these savings can lead to real competitive advantage. Even though many people have the same raw data, not everyone uses it well. Groups that forecast better can change faster, manage money smarter, and give customers good service more often. By 2026, this kind of operational edge will be even more important than now.
Challenges and Limitations of Predictive Analytics
Predictive analytics can do a lot, but it is not always right. The main problems often come up when the data is weak, the model logic is not clear, or there is a lot of work to keep things right as time goes on. If you put in bad data, you get bad forecasts.
There are also concerns about privacy, bias, and how to keep the model working well. These issues do not make predictive analytics useless. They just show that you need to have good habits when you handle, test, and read your data. The next parts talk about common problems and simple ways to deal with them in real business situations.
Addressing Data Quality and Privacy Concerns
The first thing to think about is how good your data is. If your raw data has missing parts, repeats, or mistakes, the model can learn things that are not right. This is why strong data management is so important before you trust any forecast.
Privacy is another big thing to watch. Businesses work with customer or work records and need to be careful with them. As big data grows, it is more important than ever to use data responsibly.
Here are some simple steps you can take:
Clean and check your data before you use it for modeling
Make sure only a few people can get to sensitive information
Have clear rules for data storage and use
These basics are important because good models start with reliable and well-kept information. A business will not get useful predictions from poor records or careless handling. Good work with predictions comes from trustworthy data and careful privacy steps.
Bias in Predictions and Model Maintenance
Bias can show up when the data is not fair or balanced. If the prepared data is off, then predictive models can pick up on those wrong patterns. This can lead to problems in hiring, lending, targeting, or deciding risk.
This is why it is so important to look over things often. Teams have to test what the model gives them, match that with what really happens, and see if any groups or things are treated in an unfair way. Good data analysis is more than just being right. It is about being fair and working well for everyone.
Taking care of models matters too. Markets can change, and customer behavior is not always the same. What worked in the past may not work now. That is why you need to retrain the models, check them, and update the features. This keeps the system good and helps stop things from drifting over time.
Interpreting Results and Practical Solutions
Even a strong model can make things hard if people do not read the output the right way. Many people find it hard to understand results. What a model gives is the chance of something happening, not a sure thing. Teams need to know that a forecast is just a guide. It does not promise that what it says will always come true.
Data analysts are there to help turn model output into actionable insights for teams in business. At this point, business intelligence and good ways to share ideas matter as much as the model itself.
Practical solutions include:
Explain results in simple business terms
Pair model output with dashboards or context
Review forecasts against real outcomes regularly
When people know what a prediction means, and what it does not mean, they can make better choices. The goal is not just to trust every number you see. The idea is to use forecasts in a smart way, with context, good thinking, and what you learn from real results.
Skills and Learning Roadmap for Predictive Analytics Careers
A good career in predictive analytics needs both technical skills and business sense. You need to know statistics, SQL, and Python well. These will help data scientists and analysts make strong prediction models. When you use analytics tools right, you can pull out useful tips from big data sets.
If you want to get better at these skills, it helps to follow a clear study plan. You can start with Excel and SQL. Next, move to data analysis. After that, learn machine learning techniques. This way, you can build a strong path in this field.
The mix of machine learning, analytics tools, and understanding of how to use large data sets will give you real, actionable insights.
Essential Skills: Statistics, SQL, Python, and Business Intelligence
Having good statistical knowledge helps you see patterns in the data. It also helps you make accurate predictions. If you know SQL well, you can get and change data in an easy way. This makes data management better for you and your team. Many people who work as data scientists use Python. Being good at Python lets you use strong machine learning techniques. This is one big reason why machine learning with Python is popular.
Business intelligence is another key skill. This helps you use knowledge from your data when making business choices. It helps bring value to your company. When you have all these skills together, you can use predictive analytics. This means you find actionable insights that can make the business better. In a world where data is important, these skills help you and your company move forward.
Simple Learning Pathways for Beginners
If you want to get into this field, you need to start with the basics. Learning Excel and SQL gives you a good base to work with data. These tools help you handle information and work with numbers. After that, learn simple statistics. It lets you see how data is linked and why numbers may change.
Moving on to Python is the next step. With Python, you get to know more about machine learning and predictive modeling. These are important skills when you want to work with data in new and smart ways.
It also helps a lot to learn by doing projects. Use all that you know in real situations. For example, you could build a forecasting model or look at customer data. This will help you show what you can do and really understand machine learning techniques.
Building Portfolio Projects in Predictive Analytics
Making portfolio projects is a good way to show your skills in predictive analytics. You can start small. Try using historical data to make a sales forecast. Projects like this will help others see that you know how to work with data and use statistical modeling. Once you are comfortable, try bigger projects. You can make a machine learning project that predicts if a customer will leave or one for demand forecasting. These advanced projects show that you know machine learning and predictive modeling.
You can use tools like Python or R to build your projects. Every project you finish adds to your portfolio. This shows that you can get actionable insights from data.
Future Trends in Predictive Analytics Beyond 2026
 The use of new technologies is going to change predictive analytics in the next few years. Agentic AI will help build smarter models that update fast, letting businesses answer to the market right away. There will also be predictive digital twins that act like the real things, helping people make better choices. When you add automated analytics, it makes data processing quicker and gives tools to pull out good, actionable insights. These steps can help boost operational efficiency. They also help companies get a strong competitive advantage over others in their field.
Agentic AI Forecasting and Real-Time Predictive Intelligence
Agentic AI forecasting is changing the way companies predict future outcomes. This new way to forecast uses real-time data analysis and machine learning techniques. Now, businesses can guess what will happen later with better accuracy. It brings data together from many sources, so they can make quick and smart choices. This use of predictive intelligence helps boost operational efficiency. It lets teams plan for resource allocation before problems happen. As a result, the customer satisfaction gets better and marketing strategies become much stronger. As this technology grows, it will open up more opportunities for business success in many fields.
Automated Analytics and Predictive Digital Twins
Bringing together automated analytics and predictive digital twins is now a big step forward in data analysis. This idea helps businesses make digital copies of real-world things. With this, they use real-time data to make their work run better. By turning to machine learning techniques, they can look at their historical data and figure out how to use resources and guess future events in a much better way. These changing models help make choices simpler and support predictive modeling in so many areas, like supply chain management and even how people experience customer service.
Enterprise AI Decision Engines in India
Enterprise AI decision engines are changing the way businesses in India work. These tools use big data and machine learning to help organizations get better at what they do. They can look at lots of information to give clear, actionable insights. The insights help with things like fast forecasting and better resource allocation. This means that companies can keep up with changes in market trends.
When predictive analytics is built into these engines, companies can do more. They optimize work, lower risk, and improve customer satisfaction. All of this helps an enterprise build a strong competitive advantage in a world that runs on data.
Conclusion
To sum up, learning predictive analytics can help people make better choices and boost how well things work in many industries. When you know about forecasting models and analytics tools, you can use data to get a competitive advantage. As we move past 2026, adding AI and new predictive tech will help build smarter business plans. Using these new tools means that companies can act fast and adjust to changes, which leads to better customer satisfaction and long-term success.
Frequently Asked Questions
What is predictive analytics and how does it work?
Predictive analytics uses statistical models and machine learning to study historical data. The goal is to forecast future outcomes and help with decision-making. It looks for patterns and trends, so organizations can use this information to make strategies better. This also helps companies get more done and improve operational efficiency in many areas.
What industries in India benefit most from predictive analytics?
Industries in India, like finance, healthcare, retail, and manufacturing, get a lot out of predictive analytics. They use data to make operations better. This helps them improve the customer experience, make good choices, and bring in new ideas. With these steps, they grow and stay ahead in the market.
What skills and tools are needed to start with predictive analytics?
To get started in predictive analytics, you need some key skills. You should know how to do statistical analysis. It helps if you are good at SQL and Python. You also need to know how business intelligence tools work. If you understand data visualization and machine learning, you will do even better in this fast-changing area.